
This page presents one inspectable measurement project. It is evidence of how the DecayCore workflow behaved in this setup, not a benchmark across rooms and not a promise of identical results elsewhere.
Methodology
- The figures come from the published REW project
1.0.9.1.mdat. - The plots identify an uncorrected right-channel measurement and corrected right-channel responses produced with Asymmetric, Linear, Minimum, and Mixed FIR modes.
- The response comparison is shown both from 15–250 Hz and from 15 Hz–24 kHz in the full report.
- The mode-specific report views include distortion, group delay, phase, step response, and waterfall plots.
- The original REW project, exported figures, and seven-page PDF are published with this page so the example can be inspected independently.
Scope and limitations
This is a single room, loudspeaker setup, microphone position, and source measurement project. Room geometry, placement, measurement quality, target selection, hardware, and correction settings all affect the outcome. The plots therefore demonstrate one documented result rather than a general ranking of FIR modes.
The displayed traces and axes are REW exports. Some separate views use their own displayed ranges, so compare the trace shape and labeled axes rather than treating image dimensions or color ranges as normalized metrics. No aggregate score or multi-room claim is inferred from these figures.
Low-frequency response
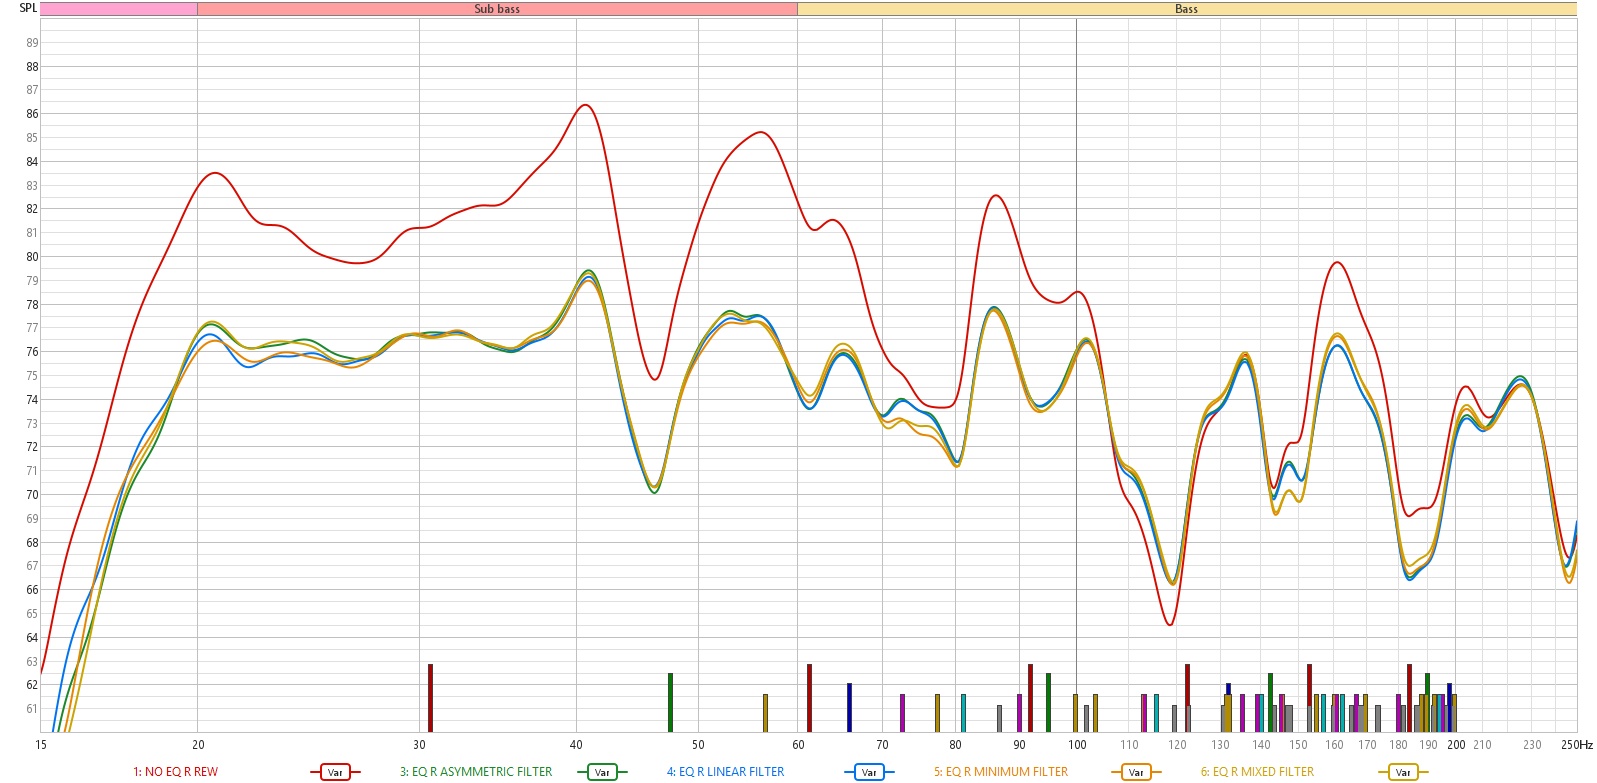
This view makes the comparison visible without reducing it to “flatter is always better.” DecayCore’s correction policy also considers headroom, phase behavior, timing, confidence, and low-frequency safety.
Asymmetric mode group delay
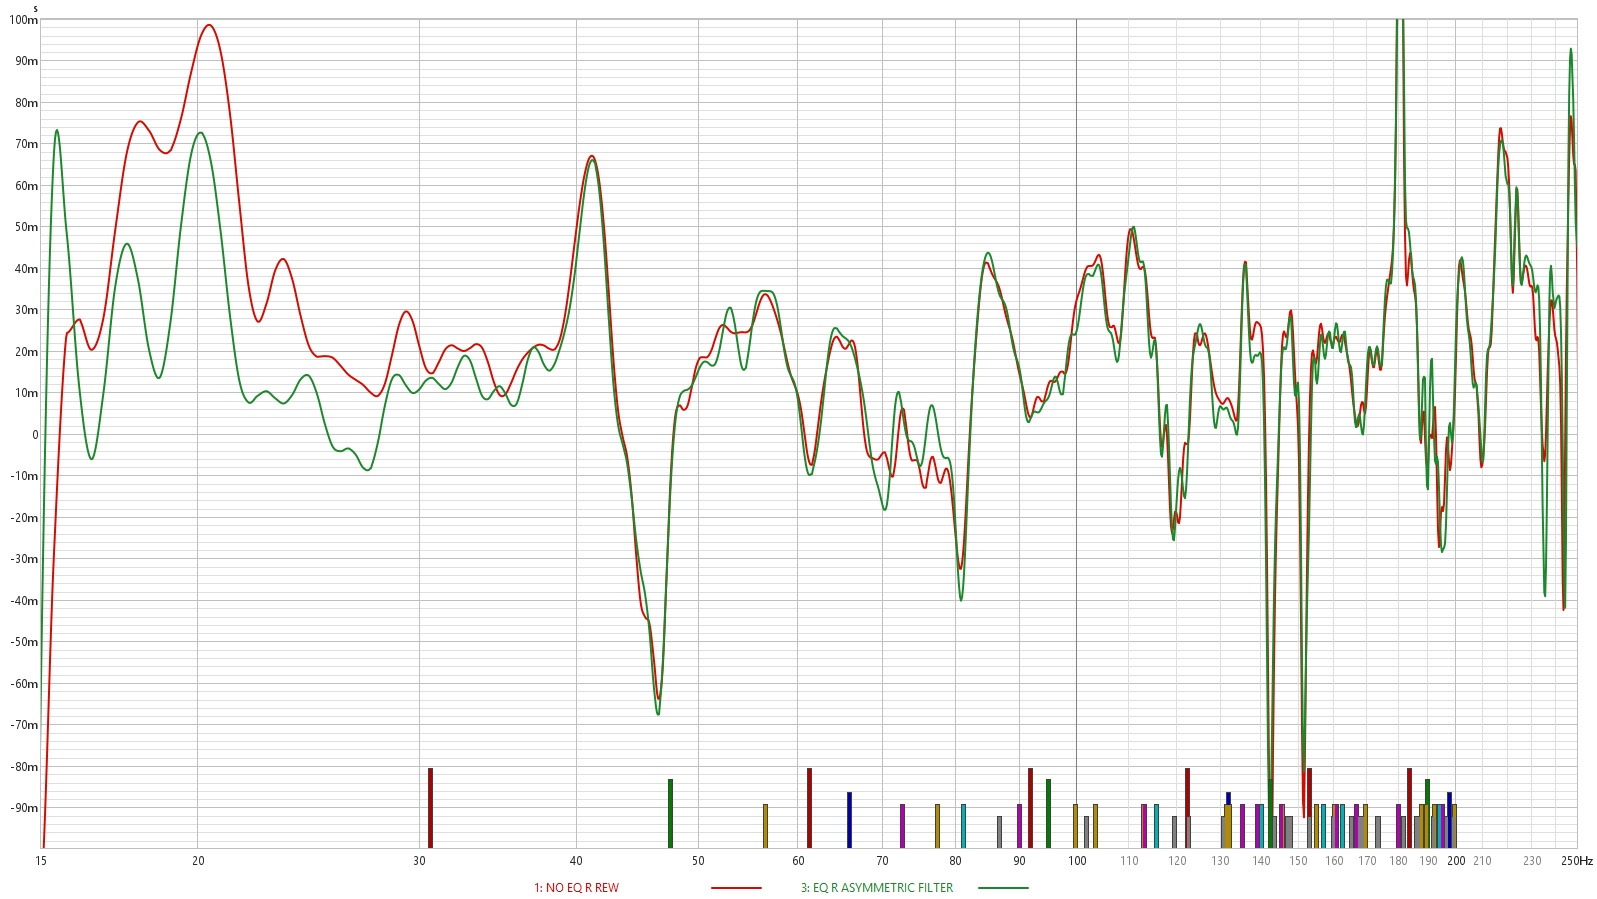
Group delay is shown separately because magnitude response alone does not describe time-domain behavior. The result should be interpreted together with phase, step response, and the correction safeguards described in the engineering documentation.
Waterfall comparison
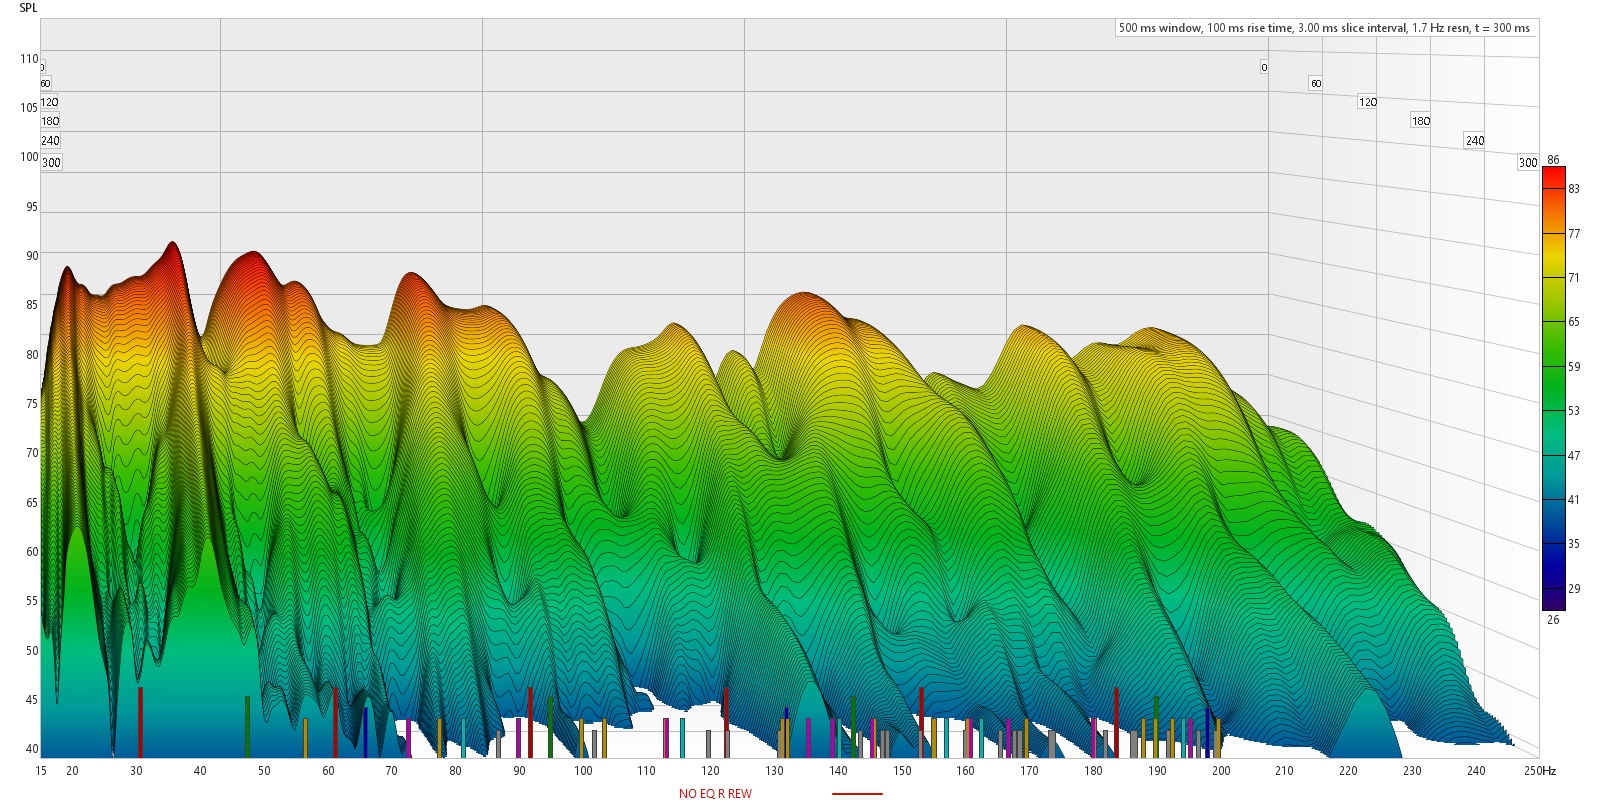
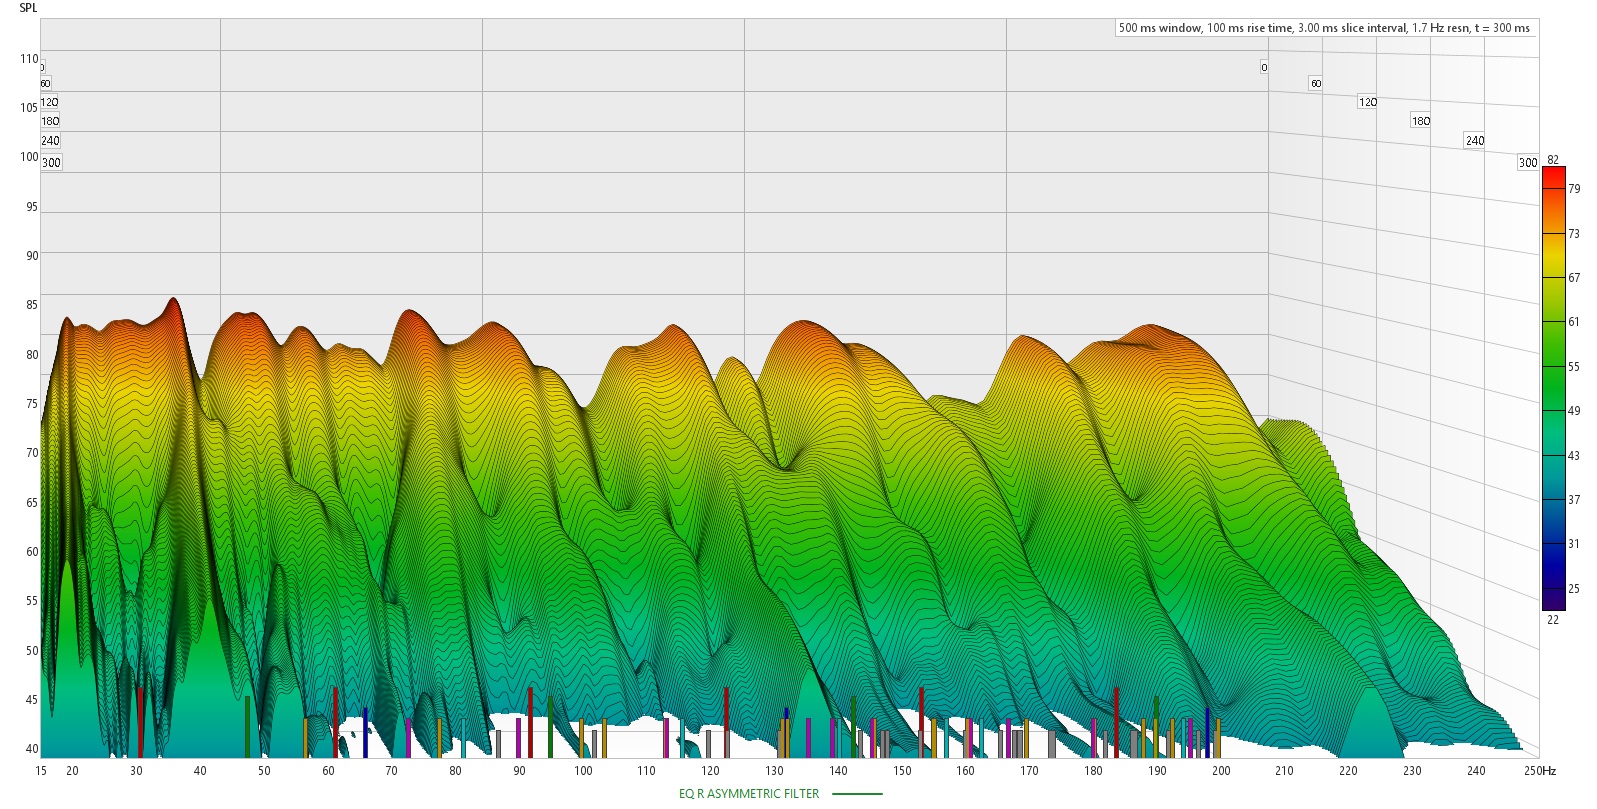
These are separate REW views with labeled plot ranges. They are included to inspect how the measured decay shape changes in this case, not as a normalized before/after metric.
Full evidence set
The full PDF report collects the response, distortion, group-delay, phase, step-response, clarity, and waterfall views. The REW source project is provided for readers who want to inspect the underlying saved project directly.
For the design intent behind bounded correction, see Engineering DecayCore.