
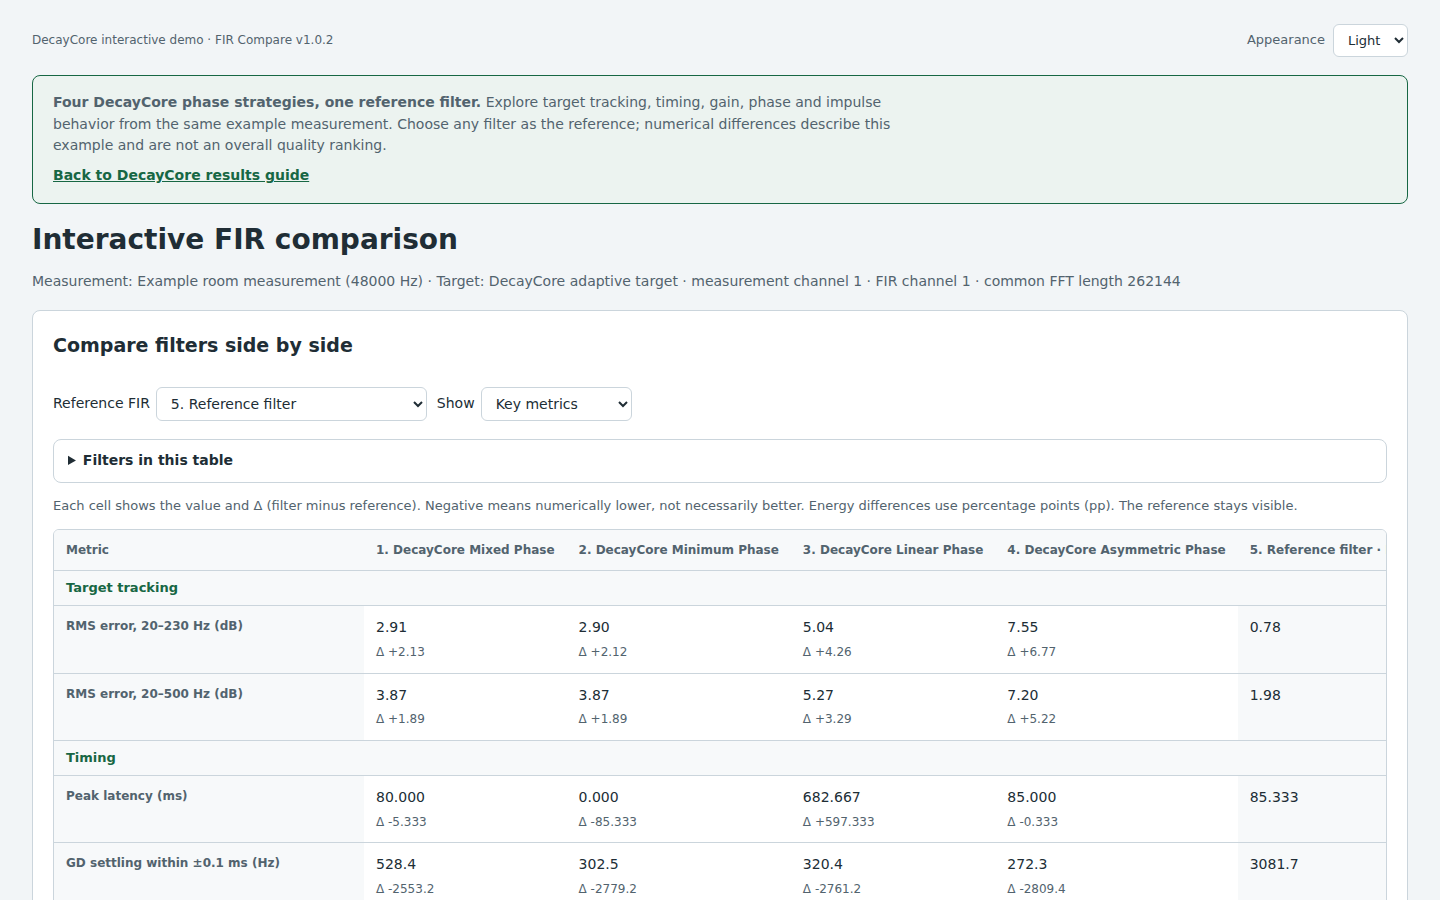
Four correction strategies can reach for a similar magnitude response while behaving very differently in time. This example puts DecayCore’s Mixed, Minimum, Linear, and Asymmetric phase filters beside the same reference filter, using one room measurement and one adaptive target throughout.
What you can inspect
The report keeps the comparisons on the same physical frequency grid and exposes the evaluated bands behind each number. You can:
- compare target error, gain, latency, settling, and impulse-energy metrics side by side;
- switch the reference filter and view signed magnitude and group-delay differences;
- inspect relative or raw FIR magnitude and phase with or without bulk delay;
- adjust plot ranges, lock vertical axes, and read values at the nearest sample.
These plots describe one measured example. A smaller target error or a tidier-looking impulse does not by itself establish better audible performance. Check headroom and safety first, then compare filters at matched playback level with familiar recordings.
For the practical checks around a generated filter, continue with Read the result, then listen.